


XRP is approaching one of its most निर्णायक technical moments in recent months, as price action compresses tightly within a descending wedge pattern near the $1.31 level. After weeks of lower highs and persistent selling pressure, early signals are beginning to suggest that bearish momentum may be weakening. However, the market has not yet confirmed a reversal, and the next few sessions could determine whether XRP transitions into recovery mode or extends its downtrend further.
You can track real-time movement via XRP price and market data.
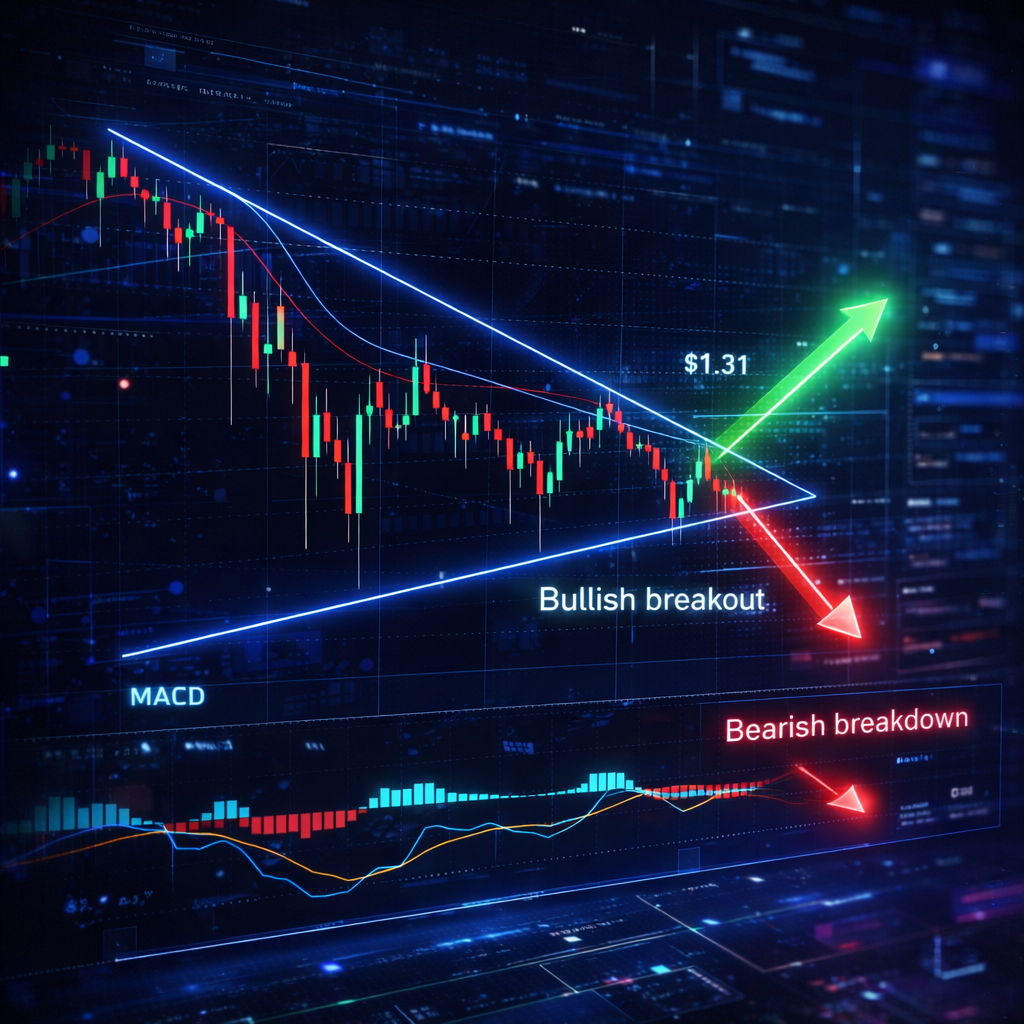
Descending Wedge Structure Signals Potential Turning Point
The current price structure of XRP reflects a classic descending wedge formation, visible across both daily and 4-hour timeframes. This pattern is typically associated with bullish reversal potential, particularly when it forms after an extended period of decline. Over the past few months, XRP has consistently printed lower highs while maintaining a gradually rising support line, leading to a tightening price range that is now nearing its apex.
At approximately $1.3157, XRP is trading at a point where volatility compression is at its peak. Historically, such compression often precedes a strong directional move, as the market resolves the imbalance between buyers and sellers. While the broader trend remains bearish, the structure itself suggests that the market is approaching a decision point where either a breakout or breakdown becomes inevitable.
For a broader understanding of how altcoins behave in such conditions, you can explore latest crypto market trends.
Momentum Indicators Suggest Bearish Pressure Is Fading
Technical indicators are beginning to align with the possibility of a shift in momentum, although confirmation is still pending. On the daily timeframe, the MACD histogram remains negative, indicating that bearish momentum is still present. However, the key detail is that the histogram has been contracting steadily, which suggests that selling pressure is gradually losing strength rather than accelerating.
On the 4-hour chart, the situation becomes more interesting. The MACD signal line has just crossed slightly into positive territory for the first time since February, while the MACD line itself is approaching the zero level. This type of convergence is often an early sign that momentum is transitioning, as sellers lose control and buyers begin to step in cautiously.
For deeper technical chart insights, traders often rely on XRP price charts and technical analysis.
At the same time, the Supertrend indicator remains bearish on the daily chart, positioned above price near $1.48. This reinforces the idea that while short-term momentum may be shifting, the broader trend has not yet been invalidated.
Key Levels That Will Define XRP’s Next Move
As XRP approaches the apex of its wedge pattern, specific price levels are becoming increasingly important in determining the next directional move. A confirmed breakout above the descending resistance near $1.47 would signal a shift in market structure, opening the door for a move toward $1.50 and potentially $1.60, where stronger resistance zones come into play. Such a breakout would not only invalidate the current bearish structure but also restore short-term bullish sentiment across the market.
On the downside, however, the risk remains significant. A breakdown below $1.27 would invalidate the wedge’s support and likely trigger a sharper decline toward $1.14. This zone is particularly important because it represents both a technical support level and a key demand area identified through cost-basis data. If this level fails to hold, it could signal that the market is not yet ready for recovery.
For a broader context on market direction, you can also review Bitcoin price trends, as Bitcoin continues to influence overall crypto sentiment.
On-Chain Data Reflects Mixed Market Signals
Beyond technical indicators, on-chain and derivatives data provide additional insight into market behavior. Recent data shows that XRP ETF inflows in the United States turned negative in March 2026, marking the first decline since these products were launched. This shift removes a key source of demand that had previously supported price stability, adding pressure at a critical moment.
At the same time, open interest across exchanges has dropped significantly from previous highs, indicating reduced speculative activity. While this might appear bearish at first glance, it can also signal a reset in leverage, which often precedes healthier market conditions.
Interestingly, funding rates have turned slightly positive, suggesting that traders are beginning to open long positions again. This indicates cautious optimism, although it is not yet strong enough to confirm a full bullish reversal.
Market Psychology: A Battle Between Exhaustion and Confirmation
What makes the current XRP setup particularly compelling is the balance between exhaustion and confirmation. On one hand, multiple indicators suggest that sellers are losing momentum, and the descending wedge pattern reinforces the idea that a reversal could be forming. On the other hand, the absence of a confirmed breakout means that the bearish structure technically remains intact.
This type of environment often creates false signals, where early buyers enter the market before confirmation, only to face further downside if support breaks. As a result, experienced traders typically wait for a decisive move—either a breakout above resistance or a breakdown below support—before committing to a clear directional bias.
Final Thoughts
XRP is at a critical inflection point where technical structure, momentum indicators, and market sentiment are all converging. The descending wedge pattern suggests that a bullish reversal is possible, especially as bearish momentum shows signs of exhaustion. However, without a confirmed breakout above key resistance levels, the risk of further downside remains.
The next major candle close—particularly on the daily timeframe—will likely determine whether XRP enters a recovery phase or continues its downward trajectory. In a market driven by both technical signals and macro factors, patience and confirmation remain essential.
Stay updated with latest crypto market trends as this setup unfolds.
Disclaimer
This article is for informational purposes only and does not constitute financial advice. Cryptocurrency markets are highly volatile. Always conduct your own research before making investment decisions.